


A quantitative research example shows how a study turns a question into measured observations and a defensible analysis. Students and beginning researchers can use published-style examples to understand how a problem, design, sample, variables and results fit together. The useful lesson is not which numbers another author obtained, but how the author connected evidence to the claim being made.
Readers working on similar documents often use the Writing a Perfect Thesis Introduction – with FREE PDF alongside the Useful Research Framework Templates PDF or the BEST Research Statement PDF Samples.
Quantitative work may describe a population, compare groups or examine relationships. Those purposes require different designs and interpretations. A numerical table does not automatically make a study rigorous, and a statistically significant result does not automatically make a finding important. Read each example as a chain of decisions whose strengths and limits need examination.
Compare the files by design, not just by subject
Visible labels in this collection cover education, nursing staff, consumer behaviour, students, teachers’ perceptions, social-media use and comparative research. Subject similarity can help you recognise terminology, but the design matters more when choosing a model. A study of perceptions may not demonstrate the same thing as a study of observed performance, even when both concern learning outcomes.
Use the on-page previews and labels to identify candidates, then inspect the actual PDF before relying on its methods. The labels alone do not verify sample size, measurement quality or statistical tests. Choose a file whose research purpose resembles your own, and consult your course or supervisor’s requirements before adopting its reporting structure.
FREE Quantitative Research Examples PDF
Educational Quantitative Research Example

File Size: 468 KB
Nursing Staff Quantitative Research Example
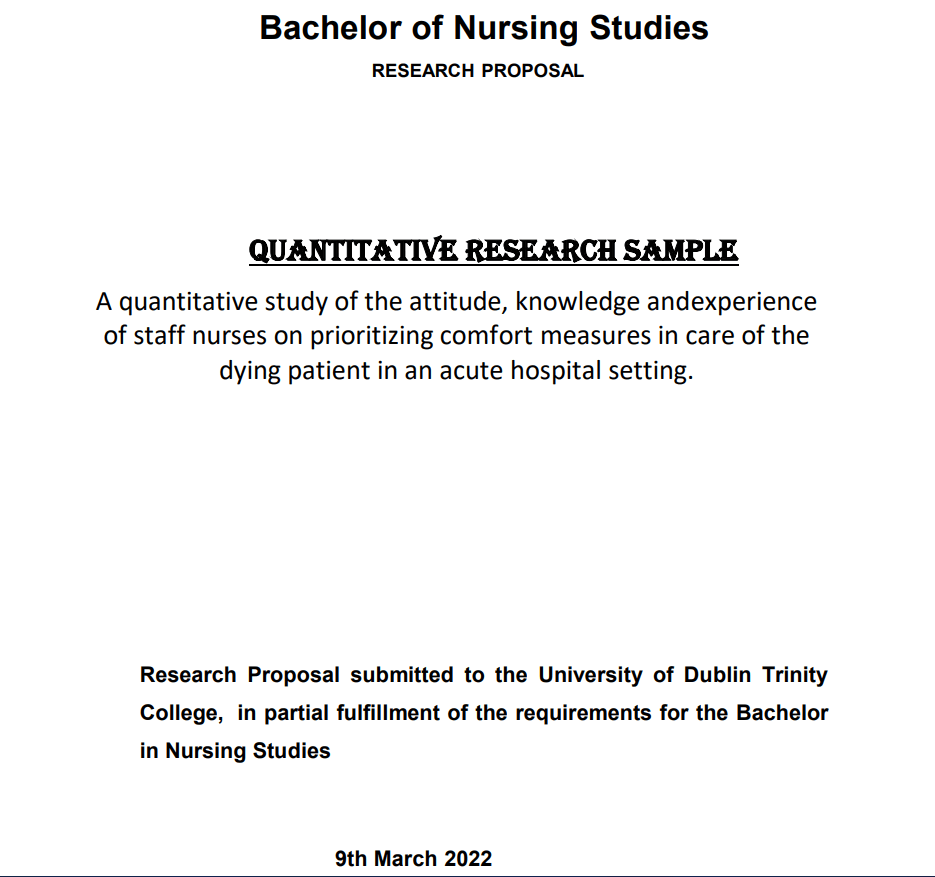
File Size: 762 KB
Trace the study from question to analysis
- Write an answerable question. Specify the population, measured concepts and intended comparison or relationship. “Does study time relate to assessment scores among first-year students?” is more operational than “What causes academic success?”
- Select a design that can answer it. Identify whether the work is descriptive, correlational, comparative or experimental, and explain why. Avoid using causal language merely because one variable is called independent and another dependent.
- Define each variable operationally. State how it will be measured, the unit or response scale and any time reference. Define how multiple items will be scored rather than leaving readers to guess how a total was produced.
- Explain recruitment and sampling. Identify eligibility, the sampling frame where relevant, recruitment procedures and the number of usable observations. Distinguish the intended population from the people you actually reached.
- Plan analysis before examining outcomes. Match summaries and tests to the question, measurement level and design. Identify how missing data, unusual observations and relevant assumptions will be handled, with appropriate statistical guidance.
- Report findings and limits together. Show relevant descriptive statistics, estimates and uncertainty, then explain what the design supports. Discuss practical meaning and alternative explanations without claiming more than the evidence establishes.
Read results without overstating them
A percentage needs a denominator. If forty respondents selected an option, readers need to know how many answered that item, not only how many people entered the study. Make clear whether percentages describe participants, responses or observations. Where respondents could select multiple answers, explain that totals may exceed one hundred percent.
An association can reflect confounding, selection effects or reverse direction. For instance, a relationship between study hours and grades might differ with prior attainment or course difficulty. A cross-sectional survey alone generally cannot determine which variable changed first. Explain plausible limitations instead of turning every association into a recommendation that assumes causation.
Report effect sizes and uncertainty when appropriate, not just whether a threshold was crossed. A small difference can be statistically detectable in a large sample yet have little practical importance. Conversely, an imprecise estimate from a small sample is not proof that no relationship exists. Interpret the estimate in the study’s context and explain what remains uncertain.
Build a transparent quantitative write-up
Methods should allow readers to understand what happened. Describe instrument sources, adaptations, administration and relevant ethical approval or consent arrangements. Do not claim that an instrument is valid simply because an example used it. Measurement evidence depends on the intended construct, population and use; adaptations may require additional checking.
Keep tables purposeful. Give them informative titles, units, sample counts and clear notes for abbreviations. Do not repeat every cell in the text; highlight the finding that addresses the research question. Retain anonymized working records and analysis decisions according to institutional requirements so reported values can be checked. Never fill a sample table with invented data presented as genuine research.
Frequently Asked Questions
Can a convenience sample support population-wide conclusions?
Its generalizability is limited because participation may differ systematically from the wider population. Describe recruitment honestly and explain who may be missing. A large convenience sample does not automatically remove selection bias, so frame conclusions around the evidence actually collected.
Do numerical rating scales always justify averaging responses?
Not automatically. Consider what the scale measures, how items were designed and whether a composite score has a defensible interpretation. Analysis choices should reflect the measurement properties and research purpose. Seek methodological advice rather than copying a calculation from an unrelated example.
What should I do when an analysis does not support my hypothesis?
Report it accurately, including the estimate and relevant uncertainty. Discuss design limitations and plausible explanations without inventing a positive conclusion or changing the original hypothesis retrospectively. Exploratory follow-up analysis can be useful, but identify it as exploratory rather than presenting it as the original test.


